Browser Vulnerability Reporting
and its relationship with market share
Introduction
The Mitre Common Vulnerabilities and Exposures (CVE) system, provides a reference system for publicly known software vulnerabilities. Any time a new vulnerability is discovered, it is assigned a CVE ID and added to the CVE list. NIST maintains the U.S. National Vulnerability Database (NVD), which is a synchronized database of all CVEs. Today, I will be using the NVD CVE dataset to identify how the number of reported CVEs has varied over time for five popular browsers.
Browser market share over time
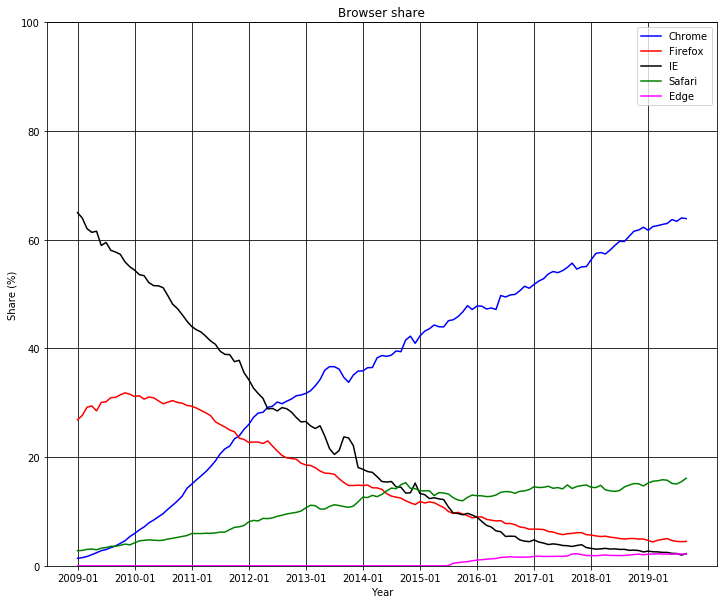
In the last ten years, the browser landscape has seen drastic change. Microsoft's Internet Explorer, which previously commanded nearly two-thirds of the market share, has been discontinued in favour of Microsoft Edge - the combined market share of both Edge and Internet Explorer is now less than 4.4%. Mozilla Firefox, which had an audience of nearly 30%, has also fallen to third place, and remains barely ahead of the Microsoft products' combined share, at 4.5%. Apple's Safari has slowly but steadily climbed in rank, and is approaching 20%. Google Chrome, however, has been the undisputed winner since its first release in 2008 - its usage has surged dramatically, and is nearing Internet Explorer's high water mark, with well over 60% of the market share.

Data courtesy of StatCounter Global Stats (https://gs.statcounter.com/browser-market-share)
Data published under Creative Commons Attribution-Share Alike 3.0 Unported License
Browser CVEs over time
It might well be expected that, given these changes in market share, vulnerabilities reported over time would follow a similar trend - this would be the logical case if vulnerabilities reported are a function of usage (i.e. security researchers dedicate effort towards locating flaws in direct proportion to user base). An inversion of this hypothesis might also make sense - browsers with greater usage may have more resources to dedicate towards QA and development, reducing the number of vulnerabilities that make it "into the wild" to be reported as CVEs.

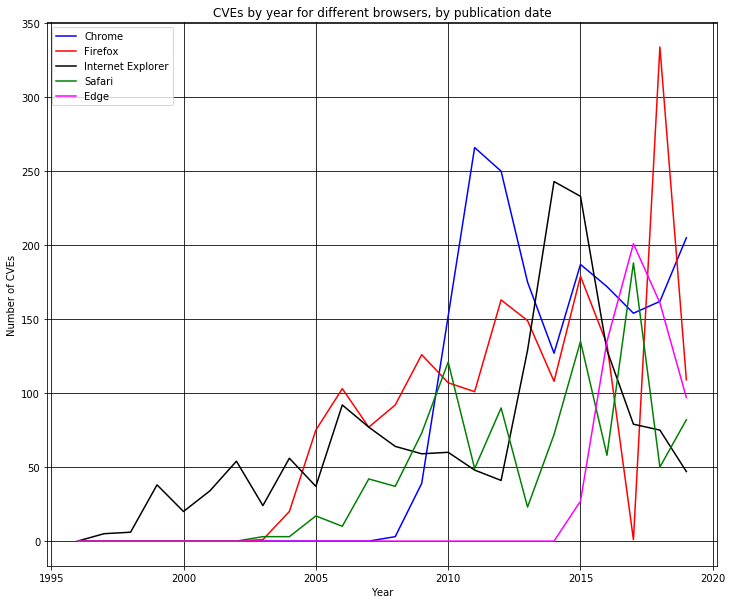
While Chrome was consistently near the top in terms of annual CVE counts, this trend began in 2011, before it passed either Firefox or IE. Notably, in 2017, despite commanding more than half the market, Chrome had fewer reported vulnerabilities than Safari, Edge, or Firefox (see note above). Further indication that other factors (perhaps vendor culture or prevailing community opinion) outweigh any impact of market share on CVE counts can be seen when comparing Firefox to Safari - despite passing Firefox in 2014 in terms of market share, Safari has had fewer CVEs reported by a fairly consistent amount. Other features to note include Internet Explorer's CVE count (which varies wildly, with no apparent association with usage) as well as Chrome's spike in CVEs in 2011/12, IE's spike in 2014/15, and Edge's in 2017 - these spikes may be related to major browser lifecycle events (Chrome's and Edge's release, and IE's discontinuation), though further investigation is necesarry to conclude as such with any certainty.
This great amount of volatility in annual CVE count by browser indicates neither of our initial hypotheses are supported: There does not appear to be a significant relationship between browser market share and number of vulnerabilities reported annually.
Continued research
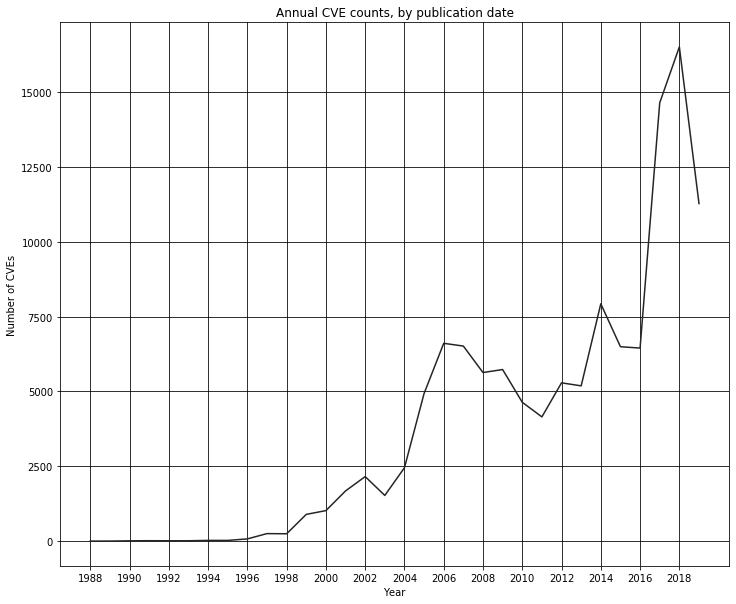
While I had insufficient time to do so, a more reliable, quantitative analysis of the data could be done by analyzing the coefficient of correlation between market share and CVE counts. Furthermore, CVE counts could be normalized, as the total reported CVEs annually has also increased significantly over the last ten years.
 Back to blog